Estimate the Natural Environment Conditions with CFD
Human comfort has been a major concern in densely populated cities. The climate changes due urban heat island and global warming affects the human comfort. The airflow within the urban canopy layer drives the moisture, heat and other types of variables in the urban streets. Hence urban areas should be designed to ensure the comfort, health and safety of their inhabitants and users.
Necessity of building orientation study :
- Wind comfort and wind safety for pedestrians is one of the critical factors to be considered in urban areas. More specifically near high-rise buildings, high wind velocities are often noticed at pedestrian level that can be experienced as uncomfortable or even dangerous. Various pedestrian level wind environment studies have been conducted with the major focus on the discomfort conditions caused by strong winds near buildings. In those studies, the effects of building properties, such as dimensions, shape, spacing between buildings, orientation of building groups, street canyons and building density, have been investigated.
- The wind loads on high rise buildings surrounded by other tall buildings in real environments may be quite different from those on isolated tall buildings. The neighboring buildings may either suddenly increase or decrease velocities which may cause fluctuating or peak pressures acting on the cladding of a building. Wind load depends on the extreme wind speeds and the extremes of the wind-induced actions or action effects.
- To provide amenity and ventilation to the bathrooms and kitchens, a recessed cavity is usually provided between two adjacent apartments where windows of bathrooms and kitchens are opened. The size of the recessed cavities helps to exchange the air between the cavities and environment. These cavities has main tendency to contain the stagnant air.
The wind flow pattern around buildings is very complicated. It is interesting to know how turbulent flow characteristics are affected by the building orientation in the urban areas, which assists in understanding the turbulent exchange process of momentum and scalars near the surface region. Detailed aerodynamic information can be obtained using Computational Fluid Dynamics (CFD), which offers considerable advantages compared to wind tunnel testing. However, the accuracy and reliability of CFD simulations can easily be compromised. CFD simulations easily allow parametric studies to evaluate alternative design configuration. CFD analysis provides the distribution of air velocity and pressure around building structures due to the wind effect and this information can be used to assess pedestrian comfort, determine local pressures for positioning HVAC intakes/exhausts.
A representative case study was performed . It will give you the flavour, how CFD is a powerful engineering analysis tool.
Objective : The major objective of the study was to determine the wind flow patterns around buildings for a given wind condition and building layout.
A typical layout of set of buildings which comprises of a tall building surrounded by the low rise buildings and row houses was considered for this analysis. We were supposed to estimate the natural environment conditions such as the velocity conditions and local pressure distribution over and around the buildings. CFD analysis domain includes the region of atmosphere to consider the wind effects. The extent of domain and its details would depend on wind direction and orientation of the buildings. The minor details of building such as windows, doors, balconies were not considered. The approximation of building shape has been done. The approximation has been done in such a way that it would not affect the flow behavior considerably. The CFD model is shown in the Figure 01.
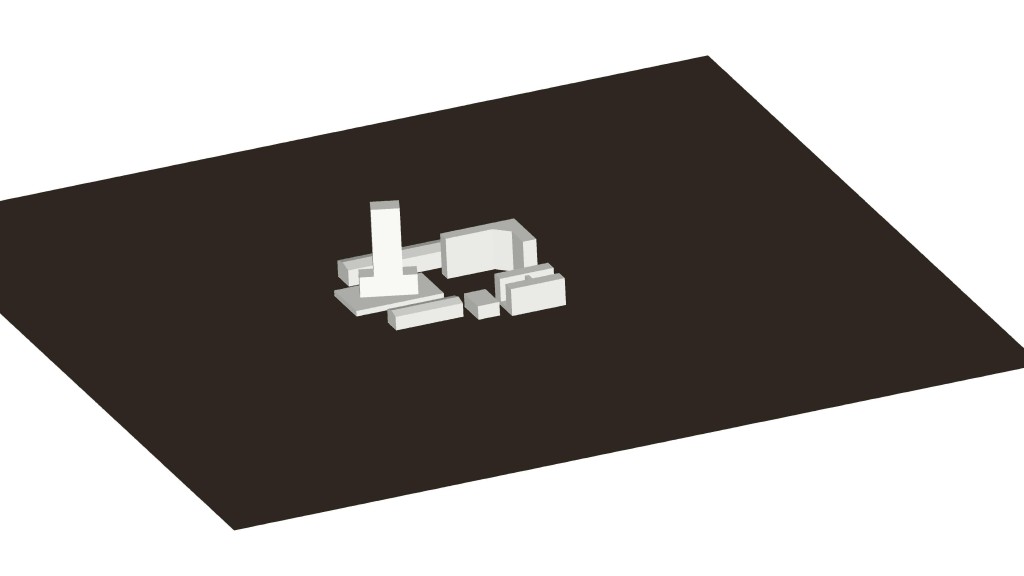
Figure 01: CFD model considered for analysis
CFD is the numerical method of solving governing equations related to fluid flow and heat transfer. In order to get the numerical solution, the CFD domain also needs to be divided into small sub-domains or cells. The process of generating such cells is called as grid generation process. As the domain size is complicated unstructured grid generation method is used. A fine tetrahedral mesh was generated. The mesh details has been shown in the Figure02.
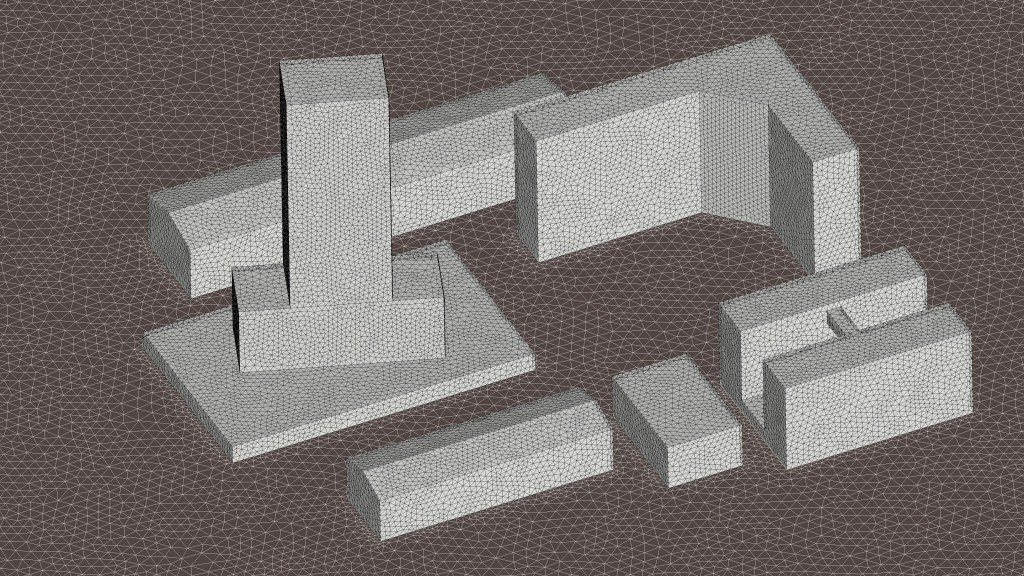
Figure 02: Tetrahedral mesh generated inside the domain
The steady-state wind-flow pattern around the buildings is obtained by solving the 3D Reynolds Averaged Navier-Stokes (RANS) equations in combination with the realizable k-e turbulence model and standard wall functions with ANSYS FLUENT. The realizable k-e turbulence model was chosen as turbulence model for this study because of its good performance in predicting airflow over the objects.
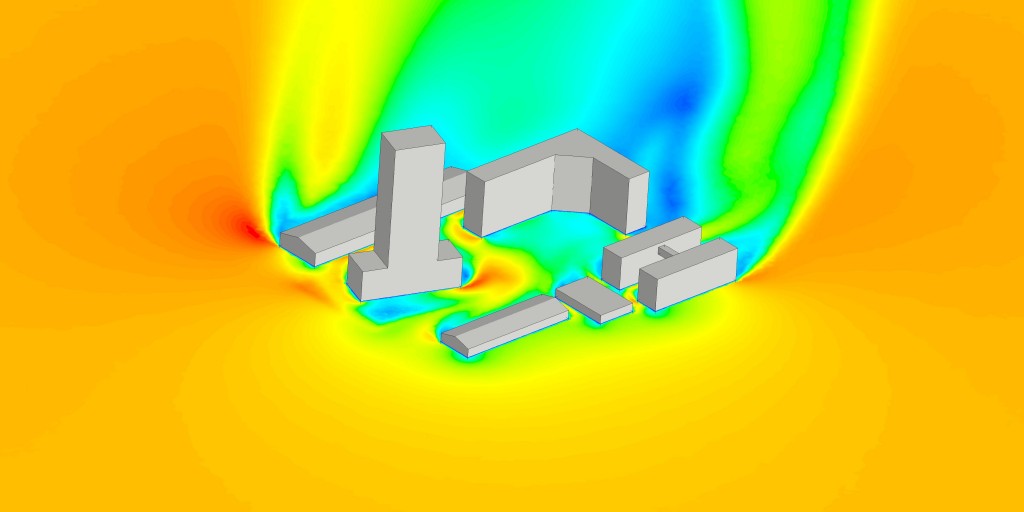
Figure 03 -A
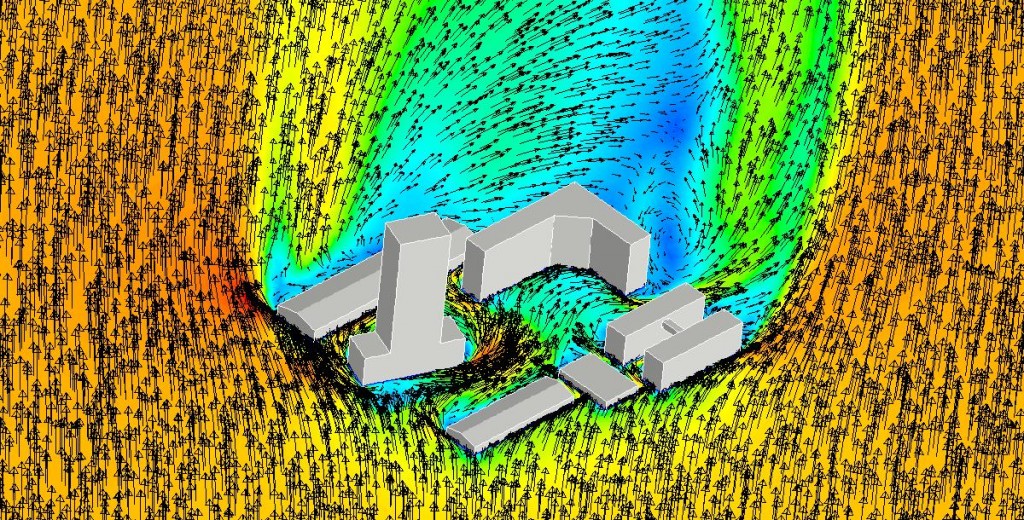
Figure 03 B
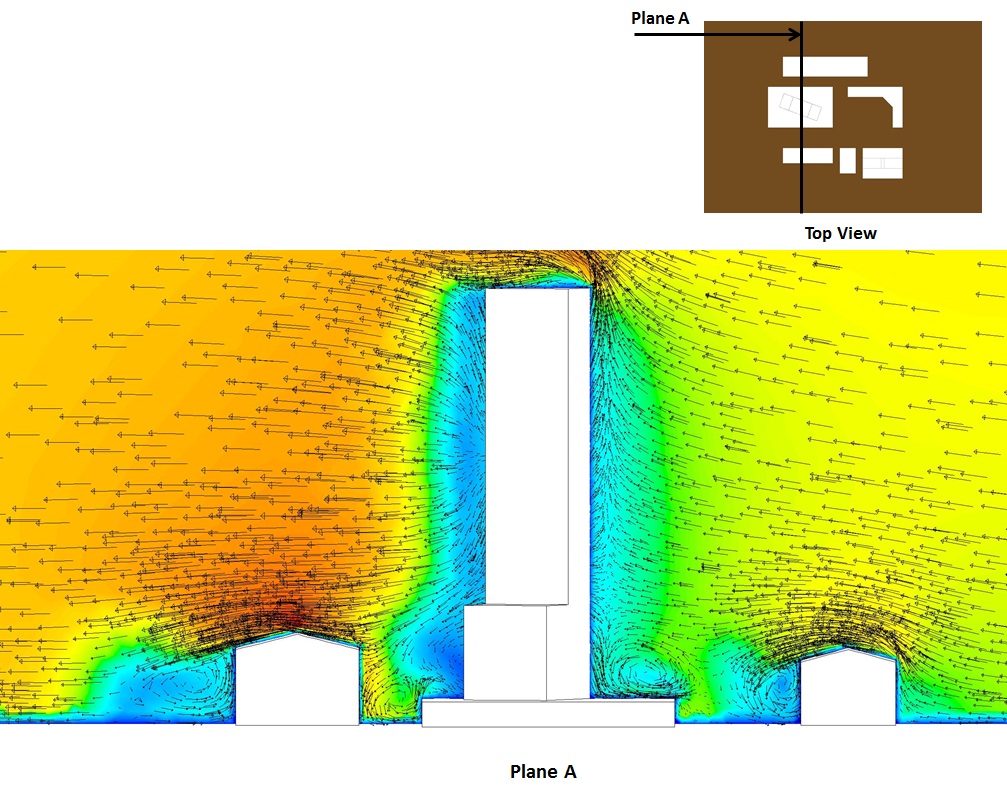
Figure 03 : Velocity profile around the buildings
The velocity distribution around the buildings is shown in the Figure 03. The velocity magnitude is plotted onto the plane passing through the buildings. The red color indicates the higher value of the velocity and blue indicates the lower value in the domain. The vectorial representation of flow onto same plane is shown in the Figure 3B. We can see recirculation zones developed across the buildings. This is due to low pressure zone generated downstream the buildings. The more detailed recirculation zones are elucidated in Figure 3C. These results show that buildings create adverse effects on the natural air ventilation at pedestrian level around the building.
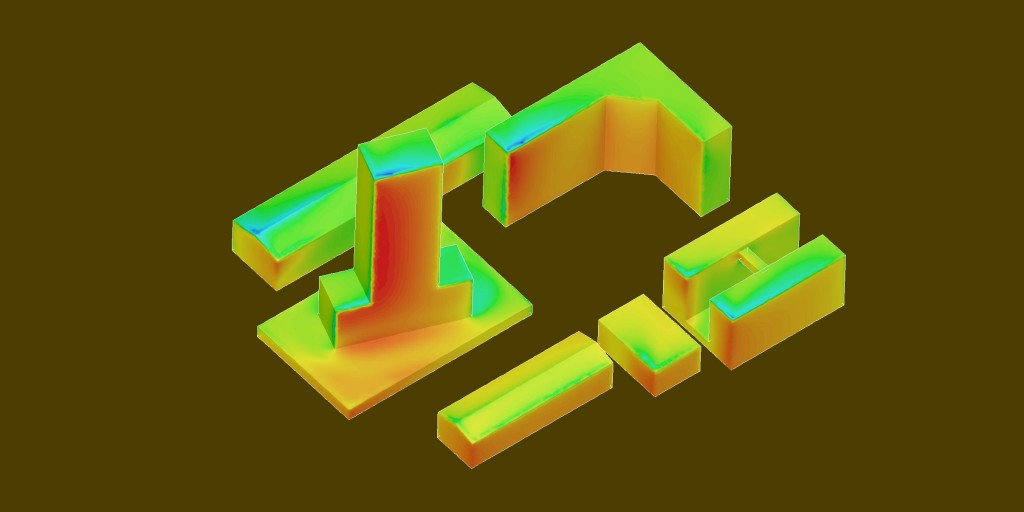
Figure 05: Pressure distribution onto building faces
This study helped to understand wind flow pattern over buildings. The recirculation zones have been determined (Figure 03 & 04). This has helped to estimate entry and exit points for building ventilation ducts. The pressure loading on the building faces was determined (Figure 05). These results will help in directional design i.e. to optimize the orientation of a building.
|
{modal index.php/en/?option=com_content&view=article&id=97}
 {/modal} {/modal}
{modal index.php/en/?option=com_content&view=article&id=97}
 {/modal} {/modal} |
CFD is a powerful engineering tool for predicting real process behavior. For flow visualization a video is attached. Check out the video which elucidates the flow behavior passing around the buildings.